by Barb Binder, Adobe Certified Instructor on Illustrator, InDesign and FrameMaker
Yesterday, I had the opportunity to deliver an Adobe-hosted webinar on incorporating Illustrator into a FrameMaker workflow. Illustrator is included with TCS4, and Creative Suite and Creative Cloud, but most of my layout students have confessed that they don’t ever open it. Turns out, they think they must be skilled artists and/or trained illustrators to use it. That’s not actually true. In the webinar, I touched on two topics that I thought would be immediately be useful to a FrameMaker user: drawing with shapes and creating charts. These two topics will be just as useful to InDesign users.
In this post, I am going to introduce you to Illustrator’s charting tools. Illustrator actually has 9 tools that can be used to create graphs. In my example below, I picked the Column Graph Tool and drew a box. The result is a very basic column graph, and a data panel waiting for data: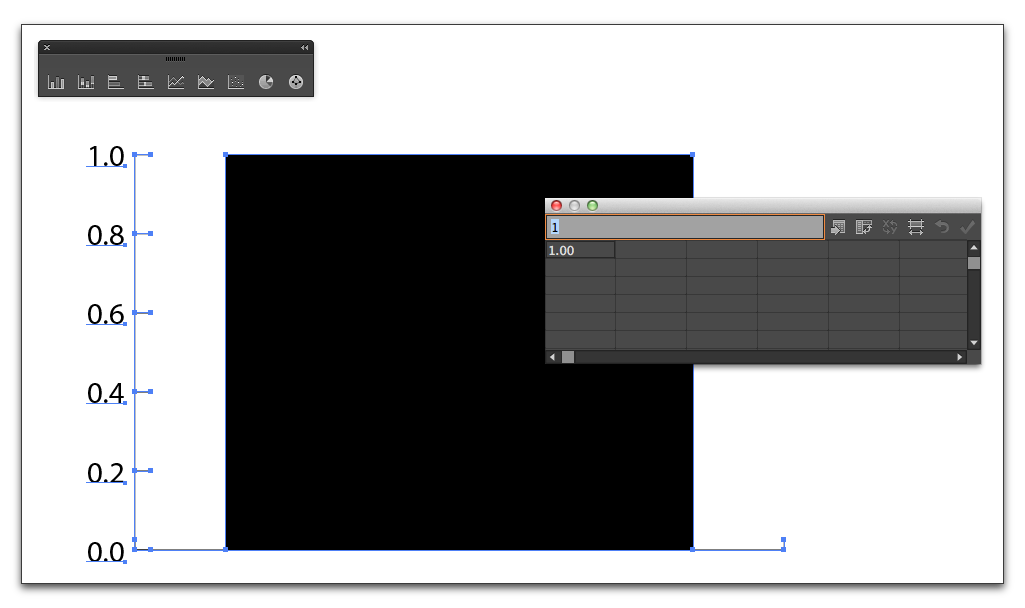
You can add data to the panel by typing, pasting from a spreadsheet or by importing a tab-delimited text file. In my example, I pasted data from Excel, and clicked the Apply check mark in the top right corner of the data panel:

Illustrator uses that data to generate a column graph:
This is where the fun begins. You can change colors, fonts, and graph styles:

And replace the basic bars with playful icons:

The charts are still fully editable. You can change the data and the type of chart and Illustrator will rebuild the chart with the new settings.
Who says charts need to be boring? For more examples of charts created in Illustrator, watch the webinar.